
PUR Volunteer Water Quality Monitoring Program

Our volunteer water quality monitoring program was created to involve the community in gathering data that will lead to a scientifically-based understanding of current and changing watershed conditions. Most of our data is submitted to the Oregon Department of Environmental Quality’s Laboratory Analytical Storage and Retrieval (LASAR) database. This database is a central location for environmental and ecological data collected in the state. By helping to populate this database we are contributing to ongoing efforts to understand and protect the beautiful natural resources of Oregon. Data on the watershed is also shared with key partners and organizations in order to coordinate local, county, and state restoration efforts. The program also plays a role in the early detection of public health risks. For example, PUR's new Blue-Green Algae monitoring study in the Umpqua is working to track and identify high risk areas for the presence of harmful toxins produced by algae. Toxins from this algae have already killed several dogs and could grow to become a danger to public water supplies.
The program also provides current water quality information to PUR’s project planning team in order to support restoration planning. As the planning process for a project is begun it is important that water quality parameters are collected. This allows us to determine the effectiveness and ecological and environmental impacts of habitat restoration. With this scientific approach PUR and its volunteers are able to show, with quantitative analysis, that our projects are efficient, effective, beneficial, and in accordance with the highest standards and best practices of stream restoration.
The monitoring programs owes much of its success to its dedicated volunteers. Without them the breadth and reach of monitoring in the basin would be greatly reduced. We can always use more volunteers. If you are interested, please contact us.
PUR monitors the following criteria in the streams of the Umpqua:

- Water Temperature - Recording and analyzing large trends in stream temperature is of great importance for understanding a watershed's health and protecting fisheries. For salmonids (salmon and trout), which are coldwater fish, healthy growth is supported by water temperatures ranging from 40-66°F; outside this range they generally do not grow in size and extreme temperatures can be lethal. These temperature extremes can affect every life stage of salmonids. Moreover, temperature andA YSI Sonde multi-parameter probe is used to take a wide range of water quality data in a short amount of time dissolved oxygen (DO) are inversely proportional; therefore, as stream temperature increases, the amount of DO available decreases. Decreases in DO may metabolically stress salmonids and increase their likelihood of disease. As water temperature increases to stressful levels, salmonids then seek cold water refugia. Sadly, extremely high water temperatures can be lethal to coldwater fish. One study found the upper lethal limits was 75.0°F for steelhead and 73.0°F for cutthroat (Bell, 1990, p. 11.4). The upper lethal limit for young coho salmon and Chinook salmon acclimated to 70°F was 78.8°F, measured as 50% mortality after 16.7 hours. Many of our monitoring sites exceeded these potentially lethal temperatures for steelhead and cutthroat and some even exceeded the higher lethal temperatures for coho and Chinook. However, unlike in the lab, natural streams have diurnal temperature fluctuations associated with nightly cooling. Therefore these high stream temperatures are not sustained for long periods of time. The driving factors for water temperature are stream characteristics, such as flow and surface area, and radiant energy, the most important source being solar radiation. Solar radiation is reduced by shading and cloud cover and increased by solar input, which is often reflected by higher air temperatures. Furthermore, streams in the Umpqua basin have been changed by the removal of riparian vegetation, water withdrawals, and by altering stream characteristics.
- E. coli and Coliform - E. coli is monitored as an indicator species of bacteria. It would be extremely difficult and expensive to try to monitor for many of the organisms that carry disease. Therefore, only E. coli was chosen to be monitored as an indicator of fecal contamination and a warning that other pathogens may also exist. It can also be an indicator that best management practices of livestock are not being observed, of failing septic systems, of a large concentration of warm-blooded wildlife contaminating the water or of a malfunctioning or overloaded wastewater treatment plant. E. coli is easily measured with EPA approval by using the protocol and supplies from IDEXX Laboratories, Inc. A sample is collected into a sterile 100 milliliter (ml) bottle, kept on ice, and returned to a laboratory for analysis. The results are expressed in terms of a most probable number (MPN) of E. coli organisms in a 100 ml sample.

- Volunteer MA and Monitoring Coordinator Sandy Lyon collect samples and record data in the fieldDissolved Oxygen - Oxygen is as necessary to aquatic life as it is to life on land. The amount of oxygen found in water is called dissolved oxygen (DO). Many factors can influence how much oxygen is dissolved in a body of water such as: Temperature (oxygen is more soluble at colder temperatures), atmospheric pressure (increasing altitude results in less pressure and therefore less ability of water to hold dissolved oxygen), and salinity (increasing salt concentration results in lower DO). Turbulent water can also increase DO, as does photosynthesis by aquatic plants during the day. At night, aquatic plant respiration actually consumes dissolved oxygen. Decomposition of organic matter also reduces aquatic oxygen. By taking what are called "grab samples" PUR can capture a snap-shot of the dissolved oxygen concentration in a stream for a moment of the day, season of year, and current stream condition. Dissolved oxygen is critical at all life stages of salmonids, but the greatest need pertains to the survival of eggs placed in the gravel. Without 11.0 mg/l egg development will be impaired or stopped. Reduced DO concentrations can adversely affect swimming performance of migration salmonids. Sustained swimming speed dropped sharply when DO fell to 6.5-7.0 mg/l. (Bjornn T. a., 1991 pg.85)

- pH - pH is defined as the negative logarithm of the hydrogen ion concentration of a solution with the scale going from 0 to 14. In other words pH is the measurement of how acidic or basic a solution is, with pH 7.0 being neutral. As you go up the scale from 7 the solution becomes more basic or caustic. From 7 down the scale to toward 0 it becomes more acidic. In a logarithmic scale, each whole unit of incremental change is equal to a ten-fold increase or decrease in the acid or base. We monitor the pH of water bodies in the Umpqua Basin to add to the overall picture and analysis of the basin and to quickly identify water quality problems. If the water's pH is too far from 7.0 species may die or be unable to reproduce. There are many complicated factors that determine a stream's pH. According to the EPA, "The largest variety of aquatic animals prefer a range of 6.5-8.0. pH outside this range reduces the diversity in the stream because it stresses the physiological systems of most organisms ... Low pH can also allow toxic elements and compounds to become mobile and "available" for uptake by aquatic plants and animals. This can produce conditions that are toxic to aquatic life, particularly to sensitive species like rainbow trout." Abnormal pH levels can also have serious implications for human health and drinking water.

- Blue - Green Algae in one of its more visible states, it should be noted that the toxins however are not visible to the human eye. Cyanobacteria - Last summer PUR began monitoring a new parameter in the Umpqua Basin: Cyanobacteria. Cyanobacteria or Blue - Green Algae includes several species that can produce dangerous and harmful toxins. In the Umpqua Basin a number of dogs have been killed over the past several years by drinking water containing these toxins. To track the spread of blue-green algae blooms PUR uses an optical probe built by YSI. This probe detects the presence of several species of alga that may produce toxins, though it cannot detect the presence of toxins themselves. In combination with temperature, and other water quality monitoring parameters, the probe allows us to quickly discover any increase in blue-green algae concentrations. Further studies are necessary, yet this process will allow the monitoring program to track and study these harmful species. The goal of this addition to the monitoring program is to identify the specific species of algae in the Umpqua that are producing toxins. PUR is also collecting samples and sending them to researchers at Oregon State University to accurately quantify the toxins and identify which species are producing them.
- Turbidity - Turbidity in a stream appears cloudy to the human eye due to the suspension of particles. These particles can be silt or clay from sediment runoff but can also come from microscopic organisms. Measuring turbidity is fairly easy with a simple sensor. High turbidity levels are a problem for both public and private drinking water systems. Fish may experience trouble breathing if particles slow the flow of oxygen over their gills. Aquatic creatures may also have trouble feeding due to diminished vision. Fish eggs and fry may suffocate if fine particles are deposited into the gravels where they are developing. Also, migrating salmon will chose to avoid waters with high turbidity and may even stop their migration until the waters clear. Several researchers have reported that turbidity levels in the 60-70 NTU range will disrupt the feeding behaviors of juvenile coho. Fry that have newly emerged are even more susceptible and have demonstrated reduced growth and tendency to emigrate from streams with levels of 25-50 NTU. “Effects on salmonids will differ based on their developmental stage. Suspended sediments may affect salmonids by altering their physiology, behavior, and habitat, all of which may lead to physiological stress and reduced survival rates” (Bash, 2001).
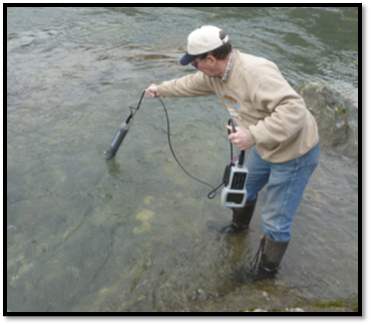
- Conductivity -Volunteer, Jim, uses the Sonde probe to collect accurate water quality data Conductivity is a measure of water’s ability to conduct an electric current. It is measured in units of current called microsiemens (µS) per centimeter (cm) or µS/cm. Conductivity increases with the amount of dissolved ions present in water and with increasing temperature. Conductivity is affected by the natural local conditions/geology. Because it is a measure of the ions dissolved in the water, conductivity will increase in areas with soils that will dissolve easily such as clay soils. Increases in conductivity may be an indication of human influences such as leaking septic systems or spills of substances containing salts (ionic compounds, not just sodium chloride) that reach the streams. There are many types of soluble salts that increase conductivity when they are dissolved in water, such as potassium chloride, calcium chloride, magnesium chloride. Acids and bases will also increase the conductivity of a solution. Organic compounds have a very low ability to conduct current, so things like oil, and sugar have a very low conductivity. The largest body of water on earth – our ocean, has an extremely high conductivity reaching 53 mS/cm – that is millisiemens per centimeter not microsiemens which is 1000 times more conductive. On the other end of the scale pure water has a conductivity of 0.055 µS/cm and typical city water is around 50 µS/cm. Because the Umpqua Basin extends all the way to the Pacific Ocean, the levels in its waters go from less than 100 µS/cm to 53,000 µS/cm with tidally influenced streams varying dramatically in the course of a day. Small, non-tidally influenced streams can demonstrate quite different conductivity levels that are seasonally affected. As a small stream reduces its flow and starts to go dry, it may demonstrate an increase in conductivity as its natural salts and minerals become concentrated in the little remaining water. During winter rains the conductivity may be reduced due to the increased volume of the rainwater. However, in storm events the surface water runoff may increase conductivity readings. There are no established standards for conductivity, however “Conductivity is useful as a general measure of stream water quality. Each stream tends to have a relatively constant range of conductivity that, once established, can be used as a baseline for comparison with regular conductivity measurements. Significant changes in conductivity could then be an indicator that a discharge or some other source of pollution has entered a stream” (EPA, 2012).
- Photo Points - Recording the changing conditions and structure of streams over time is not easy to do. By taking photos from established and consistent points annually we can track factors such as the changing shape and path of the stream channel, new or modified gravel and sediment deposits, and other important signs of change. Though taking photos may seem like a minor criteria, it is vital for the study of our watershed.